Auger effect is discovered by P. Auger in 1925. When the electron beam is irradiated on the sample, vacancies can be created in the electron level in the sample atom. This state is unstable and the sample emits a fluorescent X-ray as it tends to stabilize, allowing one electron to escape to the vacancy while the other electron escapes into free space. This escaping electron is called Auger electron.
The energy of an Auger electron movement is independent of the energy of the irradiated electron beam and depends on the intrinsic energy of the material. Therefore, the energy spectrum of Auger electrons escaping from the material can be analyzed structurally.
The irradiation source of auger electron spectroscopy (AES) usually uses a 2k ~ 10keV electron beam. The energy range of auger electron kinetic is 0 ~ 1keV. In addition to Auger electrons, there are other kinds of electrons with the same kinetic energy based on secondary electron emission in this energy range. Therefore, not only to measure the energy of the electron, but also to measure the increase or decrease of the electron due to the Auger electron.
Represented electrically, there are two signals of the same frequency, one of which has a fixed value, and the other with varying phases and amplitudes. Therefore, on the whole, it is a matter of small changes in the transfer function of the measured body. For small phase changes, changes in the output of a highly sensitive phase-locked amplifier (PSD) can be used as a measurement result.
The measurement began after adjusting the phase of the reference signal so that the PSD output was 0, and the change point of the PSD output indicated the presence of auger electrons.
Similar to AES, Vacuum Ultraviolet Photoelectron Spectroscopy (UPS) is used to measure electrons emitted from the surface of a sample. X- RAV Photoelectron Spectroscopy (XPS) etc. AES is particularly effective in qualitative and quantitative analysis of surface elements in samples. UPS can analyze the band structure of the sample and the state of adsorbed valence electrons.
XPS can be used for qualitative and quantitative analysis as well as the analysis of atomic and molecular binding states.
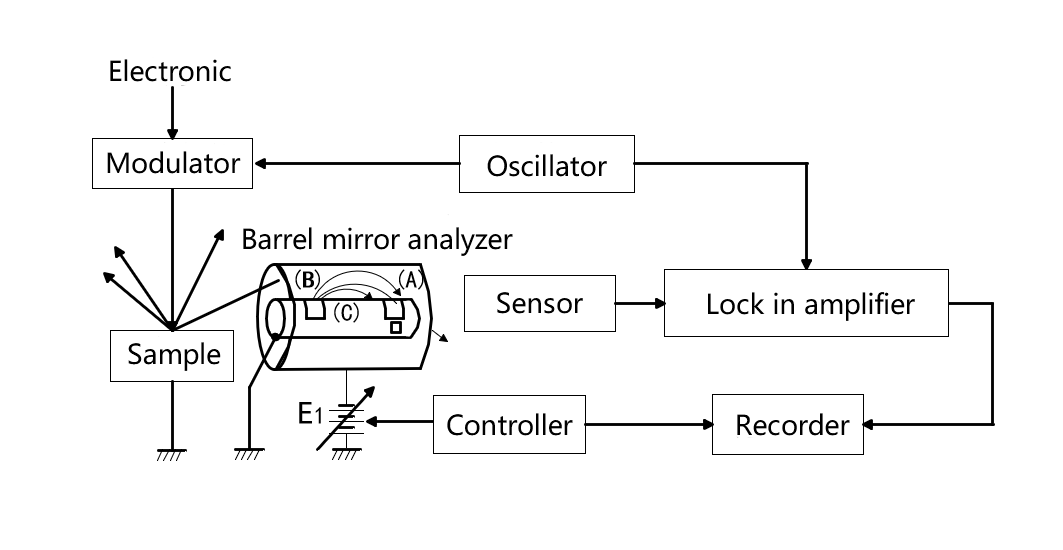
Figure 1 is a block diagram of AES. The electron beam is modulated at the same frequency as the reference signal of the PLL amplifier to illuminate the sample. Auger electrons emitted from the sample are filtered by a cylindrical mirror analyzer.

Fig.1 AES
The outer cylinder of the cylindrical mirror analyzer is negatively charged by the power supply E1, so the electron is repulsed back to the central axis when moving forward. The velocity of the electrons emitted from the sample is proportional to the amount of energy available, and only electrons (B) with a certain velocity can successfully pass through the two Windows to the sensor. High velocity electrons (A) and low velocity electrons (C) can only hit the wall of the inner cylinder and cannot be collected by the sensor. Therefore, the cylindrical mirror analyzer is equivalent to a bandpass filter BPF for electrons of different velocities (energies). The speed of the electrons reaching the sensor can be selected by changing the power supply E1, thus acting as a voltage controlled BPF.
The electrical signals from the sensor are analyzed with a phase-locked amplifier, and the changes of electronic energy spectrum are recorded according to the controller's instructions.


